Category: Highlights
G. Piffer, M. Rinaldi, Waterstones Srl
Geophysical Well log represents a powerful tool for the geomechanical analysis and in general to detect cavities and fractures.
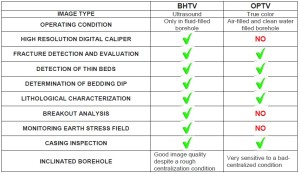
To achieve this goal is possible to use two different devices: the acoustic televiewer and the optical televiewer. In the geomechanical analysis, the used optical camera, is also named as ‘optical scanner’. It’s a slightly different tool from an inspection televiewer normally applied in water wells.
The acoustic camera (BHTV) returns amplitudes and travel times as a ultrasonic image while the optical scanner (OPTV) returns true colors images. Scanning is done in a circular manner and laterally for both devices.
Both tools need to be centralized on the borehole during the run. In case of the hole diameter exceed the nominal diameter the tool could lose the correct position at the expense of data quality.
Acoustic and Optical televiewer data are complimentary tools especially when the purpose of the survey is the structural analysis.
A common data display option for both devices is the projection on a ‘virtual core’ that can be rotated and viewed from any angle. The obtained images will complement and even replace coring survey and its associated problem of core recovery and orientation.
Acoustic televiewer is operating only in fluid-filled borehole, even in high turbidity condition as muds. The optical televiewer is working only in air filled borehole and clear water condition.
An advantage of the acoustic televiewer is to measure the diameter of the borehole through the use of the digital caliper, very useful tool in volumetric calculations.
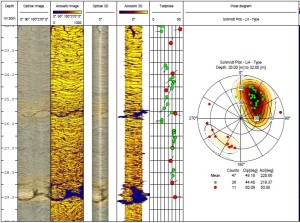
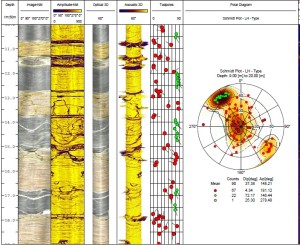
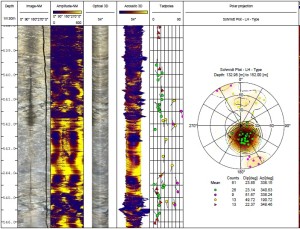
The next images (Fig.1-3) show the records, for both devices, of the same depth range at the same borehole. The examples are been recorded for different rock types and conditions. It can be noted how the devices will highlight different geomechanical properties of the same investigated rock formation.
Fig.1 OPTV and BHTV images of a vertical borehole in sedimentary rock. The sequence is constituted by calcarenite strata with diffuse primary structures.
Fig.2 OPTV and BHTV images of a vertical borehole realized in a metamorphic sequence intruded by sub-horizontal pegmatite bodies.
Fig.3 OPTV and BHTV images of a 40° inclined borehole realized in a paragneiss rock.
G. Piffer(1), M. Rinaldi (1), B. Della Vedova (2)
(1) Waterstones S.r.l. Via Bolzano/Bozenstrasse 40, 39044 Egna/Neumarkt (Bz) – Italy
(2) Dipartimento di Ingegneria Architettura, Università degli Studi di Trieste, Via Valerio 10, 34127 Trieste – Italy
ABSTRACT
The present contribution is focused on the acquisition and interpretation of geophysical logging in the geothermal well Grado2 under the technical and scientific supervision of the Department of Engineering and Architecture, University of Trieste. The exploitation of geothermal systems in conduction-dominated geothermal requires a robust understanding of the main physical properties of the fractured system, of the saturating fluids and of the water circulation pattern in the reservoir. The Wireline Logging technique, with the registration of complete data sets for petrophysical and geological investigations (Mechanical Caliper, Natural Gamma Ray, Resistivity, Full Acoustic Waveform, Acoustic Televiewer and Spinner Flowmeter logs) complemented with production logs, is a powerful tool for the assessment of these essential parameters.
Geothermal logging results allow to calibrate the geological and geophysical dataset of the area for the geothermal resource assessment and is also useful to select the most appropriate drilling and completion operations for the geothermal well.
Grado2 was adequate to become the production well of the geothermal doublet for the district heating system, whereas Grado1 became the re-injection well into the same reservoir. The Grado Geothermal Pilot Project is an initiative of the Friuli Venezia Giulia Region, Italy, supported by EU funding, for the rational exploitation of geothermal low enthalpy resources contained in deep carbonate reservoirs of the north-Adriatic basin.
1. THE GRADO PROJECT
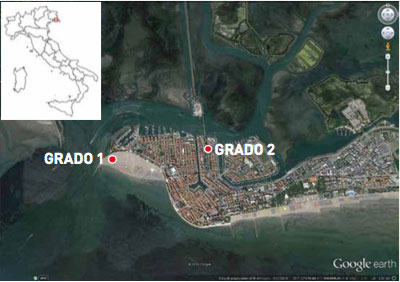
Fig. 1 The Grado Island and the
Grado1/2 well’s location
The Grado project involves the construction of a geothermal pilot plant to heat some public buildings. The geothermal district network is connected to two wells ca. 1,100 and 1,200 m of depth, located within the city center and they are away from each other 1 Km (fig. 1). Distribution network provides geothermal water at 47-49° C transferring heat to the exchangers. The return water from the heat exchangers is collected and conveyed to the re-injection well into the same deep reservoir (Working group DIA-UNITS and FIT, 2014). The Geological Office of the Friuli Venezia Giulia Region and the Municipality of Grado have developed the two main phases of these Geothermal District Heating Project:
• The first phase was aimed at the characterization of the geothermal carbonate reservoir in the Grado area, to estimate its geothermal potential through the execution of geophysical surveys and the drilling of the first exploration well named Grado1; the phase was completed in July 2008;
• The second phase was aimed at completion of geophysical surveys for the location of the second well, the drilling of the well known as Grado2, the evaluation of geothermal potential and the production capacity. Work began in 2012 and were completed in December 2014 – January 2015.
2. HYDRO-GEOLOGICAL SETTINGS
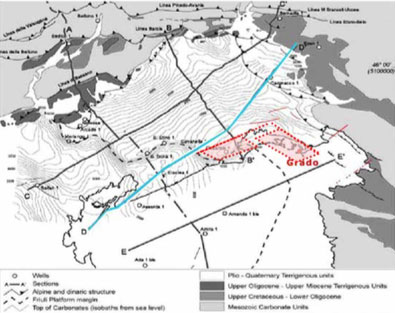
Fig. 2
The Grado Island is located at the south-east of the Grado Lagoon, Provincia of Gorizia, in the Friuli Venezia Giulia Region, Italy. The Friuli plain hosts a complex of confined and unconfined aquifers within an hydrogeological articulated system, developed mainly in N – S direction. The hydrogeological system occupies a heterogeneous sedimentary wedge, characterized by a progressive increase of thickness to W and to the Adriatic Sea where locally exceeds the thickness of 500 m (Della Vedova et al., 2014). This sedimentary wedge consists of the following stratigraphic sequence:
• Plio-Quaternary sediments, deposited in shallow marine, coastal and alluvial environment organized in several transgressive-regressive cycles; the terrigenous cover consists mainly of sandy layers / gravel and silt, with primary porosity extremely variable;
• Alpine Molasse of Oligo-Miocene age, made up of prevailing marl intervals and minor sandstones, deposited in shallow marine environment; characterized by low matrix permeability, but locally affected by systems of fractures and faults;
• Eocene turbiditic Flysch of the Dinaric foredeep consists prevailing marl intervals, rich in deep sea pelagic fauna; with low to very low permeability.
The Cenozoic sediments represent a clastic wedge overlying the Mesozoic limestone platform. Generally the carbonate platform show an articulated morphology, with two clear culminations under the Veneto-Friuli coast. They are bounded by normal fault and transtensional systems deeply rooted in the carbonate basement oriented according to the direction of Southern Alps and Dinaric Chains (Della Vedova et al., 1988, 2008, 2014). Some of these tectonic structures allow the migration of hot mineralized fluids along a crack networks (Della Vedova et al., 2008). In correspondence of the Grado structural high, the carbonate platform is buried under 500-600 m of Cenozoic sedimentary sequence (Fig.2-3, Della Vedova et al., 2008; 2014)

3. GEOTHERMAL MODEL
The platform structural high of Grado host a hydrothermal reservoir porous and fractured allowing the convective circulation of geothermal waters in the first 1-2 km deep (Della Vedova et al., 2014). The convective cells generate higher temperature gradients at the base of the overlying sediments wedge, which contain colder hydrothermal aquifers heated by conduction from the bottom (Figure 2). In this general framework, the Neogene and Paleogene marl sequences can be considered own a very low permeability, and therefore they represent a hydraulic barrier.
4. GRADO 1 AND GRADO 2 GEOTHERMAL WELLS
According to the geological context suggested by the collected multidisciplinary data, the Grado1 well was drilled on the beach, in the west side of the City of Grado, about 100 m from the shoreline. The well intercepted the carbonate reservoir to 618 meters deep and reached a total depth of 1,110 meters (Della Vedova et al., 2008).
The well Grado2 was drilled on a structural high located in correspondence of the city center (Poletto et al., 2013; Della Vedova et al., 2015), about one kilometer east of the Grado1 well. The drilling program of both wells provided for the adoption of decreasing diameters with depth (24 “, 17” ½, 12 ¼ “, 8 ½”); from ca. 670 m depth, in the upper part of the carbonate reservoir, the hole has been left uncased for the execution of wireline geophysical logs. Steel casing K55 API (20 “, 13” 3/8, 9 “5/8) have been installed and cemented.
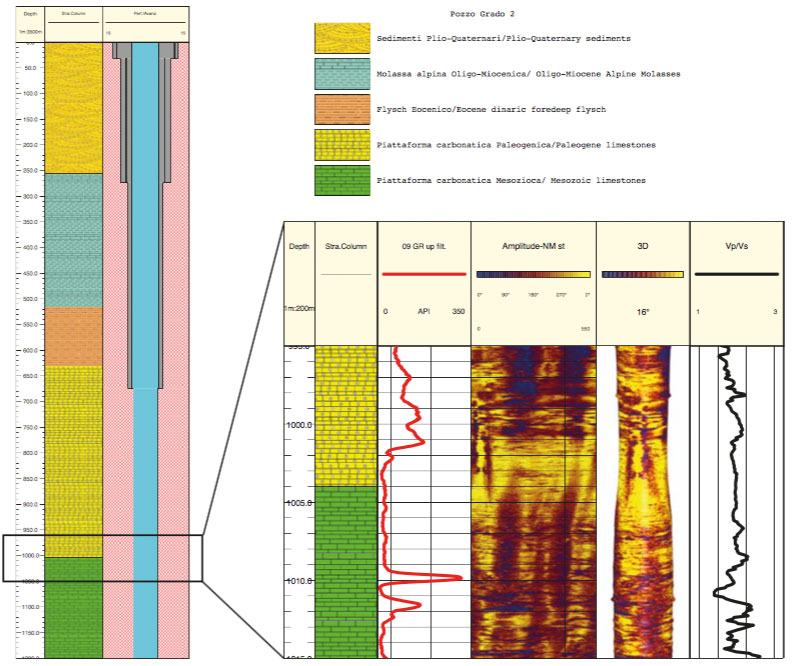
The stratigraphy of the Grado1 and Grado2 wells allowed to characterize the geothermal reservoir in the structural highs of the carbonate platform, buried under about 620-670 meters of silicoclastic sediments. The carbonate platform is made up by a thick interval of Paleocene limestone as well by Upper Cretaceous limestone (Fig. 4) The Cenozoic-Mesozoic transition turned out to be well marked in both holes at about 1000 to 1010 m deep by high Uranium’s peaks, also recognized offshore in the northern Adriatic oil wells (Cimolino et al., 2010; Della Vedova et al.,2014).
5. POTENTIAL OF THE GEOTHERMAL RESERVOIR
All data collected have been integrated into a preliminary numerical thermo-fluid dynamic model of and compared with the geological context found on land and at sea, including data from oil and water wells (Della Vedova et al., 2008; et Cimolino al, 2010).
The reservoir is constituted by a confined aquifer fractured, having a salinity of more than 30 ‰ and a temperature of 49.5 ° C at the bottom of the Grado2 well and about 42 ° C in Grado1 well. The geochemical analysis of the geothermal waters indicate that the fluid is anoxic sea water having an age of over 10 million years (Della Vedova et al., 2014).
This means that the geothermal water circulating through a complex network from the oldest Cretaceous limestone to the youngest Paleogene limestone, while the reservoir volume can be estimated at 75-100 km³ (Della Vedova et al., 2014).
Following two acidification cycles of the well Grado2 was reached an artesian spontaneous outflow of about 100 t/h (laminar flow up to 28 L/s) at a pressure of 240 kPa at the wellhead (Della Vedova et al., 2014). Considering this artesian spontaneous outflow and assuming 20° C as useful difference temperature, the thermal power of Grado2 well turns out to be 2.3 MWth (1700 TOE/h). Because sustainable production was estimated at about 126 t/h (≈35 L/s), the potential heat available is estimated at approximately 3 MWth (2200 TOE/h), (Della Vedova et al., 2014).
Geol. G. Piffer, Ph.D. M. Rinaldi; Waterstones S.r.l.
The control of collapse phenomena, and more generally of the landslides of rock slopes is generally based on the definition of the geomorphological framework, lithological and local structural. The knowledge of the geomechanical properties of the rock mass and the definition of the hydraulic circulation conditions should permit the establishment of a kinematic model which provides for the movement over time up to the eventual rupture of the slope.
The development of a realistic kinematic model that takes into account of the depth stress state variations with time and seasonal changes is extremely complex and difficult to assess. In such state it is therefore necessary to resort to using a monitoring systems capable of measuring the deformations over time of the rock mass or portions of it.
The acquisition and the analysis of data sets achieved through a monitoring system allows the developing of the kinematic model measuring the ongoing deformation. The monitoring represents therefore the main tool for the evaluation of potential risk areas and to determine the risk exposure of the site, depending on the intensity of the expected phenomenon (vulnerability).
The gravitative deformation in rock slopes are generated by significant movements at the major joints. In general, the stability of rock slopes is controlled by the rock structural setting, temperature, and changes in the H2O content and its physical state (liquid / solid) within the same discontinuity.
Before startup an instrumental monitoring program of rock slopes, it is necessary develop one or more working hypotheses concerning the geometry of the unstable elements and the relative rupture kinematic mechanisms. It is therefore basilar to identify the main disjunctive systems affected by the ongoing deformations.
Evaluated the potential kinematic breakage that can occur along the main rock mass discontinuity it is possible to choose and dimensioning of an instrumental measurement system. Generally the instrumentation employed in the rock slopes monitoring provides the topographic control with optical targets, the use of surface clinometers, multipoint extensometers in borehole, electrical crackmeters along discontinuities and microseismic stations.
In this framework, the geomechanical monitoring of discontinuities using electrical crackmeters, is certainly one of the most simple and inexpensive methods. Based on the experience developed by Waterstones srl in this field, this type of monitoring should conform to certain characteristics:
- – the need for an fully automated monitoring system;
- – the need to performs the instrumental monitoring for a sufficiently prolonged period of time, at least one year;
- – the need to measure the air temperature in sito. The crackmeter most frequently used in the are of 2 types: potentiometric transducers and vibrating wire transducers. These latter are more affected by changes in temperature and therefore necessarily require a thermal correction.
The most common type of anchorage is the mechanical type. Crackmeters with different measuring ranges are available. It possible using extension rods as a function of the distance between the anchorages. The choice of the instrumental measuring range should be made according to the magnitude of the expected movements. Without knowing the real behavior of the discontinuity is good practice to position the transducer halfway and then, if necessary, recover its run.
Once collected the measurements for a full annual cycle, the measured displacements are plotted as function of time. Based on the measured residual displacements at the end of the annual cycle we can define whether a discontinuity can be considered active or not active.
Fig. 1. Development of the kinematic model in the rock slope stability
Inactive joints
In case of a non-active joint the measured displacement at the end of an annual cycle must be necessarily negligible. On the other hand the seasonal movements can range from few tenths of mm to several mm (Fig. 2).
Fig. 2. Plots of the measured displacements as a function of time detected for some not-active joints. Negative values indicate an opening movement of the discontinuity. It is shown for comparison also the trend of the air temperature.
Active joints
In case of active discontinuity, the residual displacement at the end of the annual cycle is not negligible but indicates a opening or closing movement. Usually the behavior of an active joint appears to be controlled by the annual thermal cycles to which the rock mass is subjected. The displacement-time plot therefore shows a ‘steps’ feature in which the displacement seems to be concentrate in some months of the year (Fig. 3).
Fig.3. Plot of displacements as a function of time detected at some active joints. Negative values indicate an opening movement of the joint. It is shown for comparison also the trend of the air temperature.
It can be considered that repeated cooling and heating cycles, the rock mass is subject to processes of thermal contraction and thermal expansion. This condition causes the spatial propagation of the discontinuities and the possible increase of the displacements along them. Even if in the short term these dynamics generally do not affect the overall stability of the slope, it may lead to the progressive increase in the rock deformation, until the its rupture.
Historical case: behavior of active joints during of the consolidation of an unstable rock volume
The experience acquired in many sites gave us the opportunity to directly verify the validity of the monitoring as a tool using it during of the consolidation phase and after it.
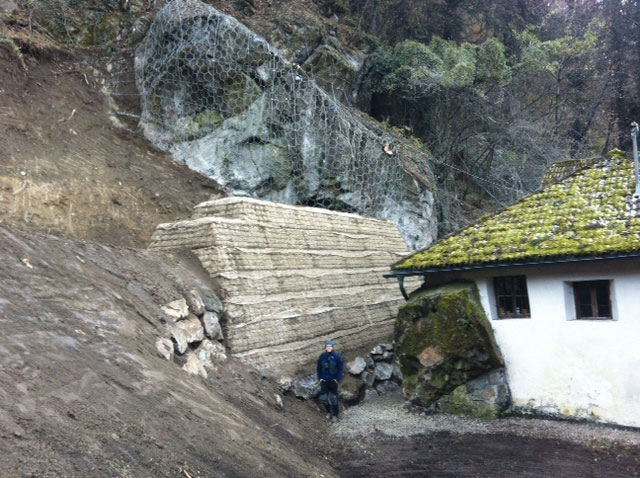
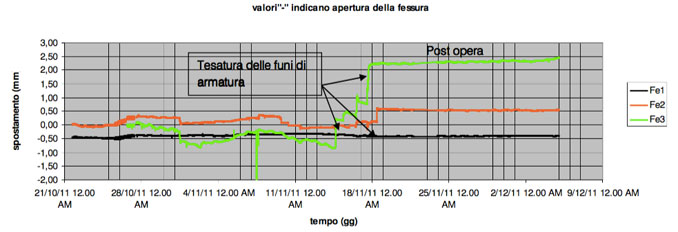
The hystorical case, shortly described below, refers to an unstable rocky volume having a size of ca. 120 m3 it located above of a historic building in South Tyrol, Italy (Fig. 4). The displacement plot (Fig. 5) shows the behavior of some active joints during of the tensioning of the steel anchor systems installed along the slope. After the tensioning phase of the steel ropes there are no more movement recorded ate the monitored joints. Monitoring system can therefore be maintained in the post work stage as a valuable tool to test the effectiveness of consolidation performed.
Fig. 4. The rock bulk subject of active consolidation, Valdinova South Tyrol, Italy
Fig. 5. Displacement plot as a function of time: values detected for the main active joint which defines the upper portion of the unstable rock mass. During the tensioning of the steel ropes it was measured a main closing movement of the joint in correspondence of crackmeters Fe3 and Fe2 of 3.00 mm and 0.50 mm respectively. The monitoring system was integrated with two strainmeters for the control of the steel ropes stress.
Geol. G. Piffer, Ph.D. M. Rinaldi; Waterstones S.r.l.
The Waterstones srl, Neumarkt (BZ), is a service company that deals with geophysical log in borehole and well. The well log technique has found great development from the ’60s and it is used to determine the physical properties of the borehole’s walls, of the fluids and of the surrounding rocks. A log is a continuous record of physical properties as a function of depth.
The Well Log provides the use of a specific tool that is lowered into the hole. The tool is connected to the surface by a steel cable that also allows the transmission in / out of the data. The cable unrolling is controlled by a mechanical winch equipped with an encoder connected to a data acquisition console and a pc. The encoder detects the tool depth.
A specific activity of the Well log concerns the use of the optical scanner OPTV inside sub-horizontal boreholes realized by core destruction technique on the advancing front of the underground construction sites (Fig 1-2).
Fig. 1. Pilot boreholes slightly drilled upward realized on the advancing front of the Brenner Basis Tunnel Bbt, Mules window, Italy.
Fig. 2. Realization of sub-horizontal boreholes at the advancing front of the SS16 road tunnel excavation, Laives, Italy.
The use of core destruction drilling technique has the advantage of being performed quickly and at lower cost compared to the continuous core technique. For this purpose it is possible perform 2-3 pilot boreholes variably directed and staggered in length on the same excavation front. The core destruction technique makes the borehole walls rather irregular but doesn’t compromise the quality of the structural analysis that can be performed (Fig. 3).
Fig. 3. Quality image detected by the OPTV optical scanner. The record was carried out inside an sub-horizontal borehole drilled on porphyric volcanic rock. Is notable the diffuse band structure of the rock and the presence of several fractures. Road tunnel excavation SS16, Laives, Italy.
The centralized tool is introduced into the borehole so as to obtain the highest image resolution, and the correct data of inclination and azimuth. The optical scanner OPTV generates an 360 ° continuous and oriented image of the borehole’s wall by means of an optical system and a conical mirror. The tool illuminates the borehole wall through a series of led placed above the optical system. The scan is done laterally and in a circular manner. The tool is able to perform a scan every 2 mm of shift with max of 720 pixels sampled from each single scan.
The obtained wall’s image is developed on the plane and oriented to magnetic north, on this plane image any cross structures (diaclase, fractures, faults, layers, laminations, foliation, etc.) corresponds to an sinusoidal tracks (Fig. 4 ).
Fig. 4 Optical scanners OPTV: working principle and true color image unrolled on the plane with sinusoidal traces related to litho-structural changes.
The possibility to obtain an accurate geomechanical analysis supported by hundreds of structural data (Fig. 5), easily usable and archivable, has convinced a growing number of design firms and construction companies to adopt this methodology of investigations.
Fig. 5. Geomechanical data processing using optical image OPTV.
The Waterstones S.r.l. is able to perform OPTV logs in sub-horizontal borehole up to some hundred meters in length. The measure of the deviation of the borehole allows the determination of the direction and inclination of any single structures detected from the OPTV images (Fig. 6).
Fig.6. Deviation data processing of a sub-horizontal borehole.
The processed data are decisive to a rational sizing of the tunnel lining, to detect fractures and cavity, to locate the main water inflow and to characterize zones with poor geotechnical characteristics such faults and cataclastic rocks. The remarkable image quality permits to perform facies analysis and recognize primary structures. The image quality is highly dependent on the cleanliness of the borehole’s wall and on the water conditions.


